Verdict Index™
Investors don’t buy growth — they buy growth they can underwrite
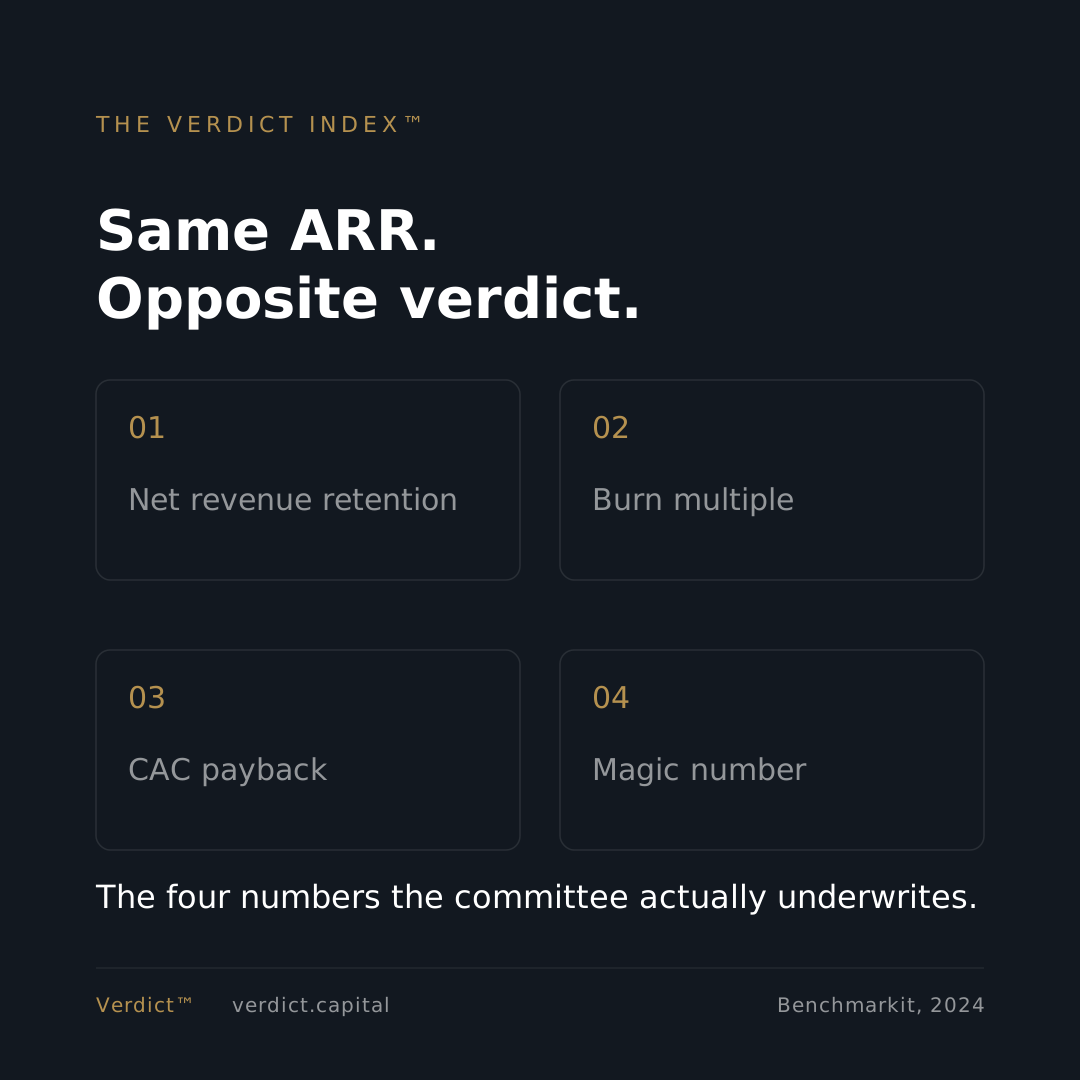
Two startups with the same ARR and the same growth rate can read as opposite bets — because the investment committee underwrites four efficiency numbers that most founders have never been shown. The analytics tell you what grew. The diagnosis tells you whether investors can underwrite it.
~6 min read · Source: Benchmarkit 2024
A founder sells growth. An investment committee buys efficiency. The round dies in the space between the two. This is the mechanic behind the majority of Series A rejections from founders who were genuinely growing — not fraud, not a bad idea, not a small market. They walked in showing the number the investor asked for, and the investor’s model wouldn’t close.
The reason is structural. When an investment committee evaluates a B2B SaaS company, they do not evaluate growth in isolation. They evaluate whether the growth is efficient enough to be financeable at the multiple they need to return the fund. That requires four numbers. Most founders know one of them.
The four numbers investment committees actually underwrite
CAC payback period. How many months of gross margin does it take to recover the cost of acquiring one customer? The benchmark depends entirely on your contract size. For companies with average contract values at or below $5,000, the best-in-class threshold is around nine months — investors at that ACV expect customer economics to close quickly because the sales motion is transactional. For companies above $100,000 ACV, the enterprise sales cycle is longer and the relationship more complex; investors accept a payback period out to around 24 months. Across all ACV ranges, best-in-class is under 12 months. The 2024 median for B2B SaaS sits around $1.76 in sales and marketing cost per $1 of new ARR generated (Benchmarkit, 2024). When that number rose from $1.32 in 2022 to $1.61 in 2023, it did not mean companies were growing less — it meant the same dollar of growth was getting more expensive to produce.
Net revenue retention. NRR measures what existing customers do over 12 months — expansion, contraction, and churn combined. The 2024 median for B2B SaaS sits around 101%. Best-in-class is 120% or above. An NRR above 100% means the cohort grows without any new customer acquisition; below 100% means you are filling a leaky bucket. Series A investors model NRR as a proxy for product-market fit in the existing base. A company with 80% NRR and strong new logo growth is still, structurally, a company that loses most of the customers it works hard to win.
Gross revenue retention. GRR isolates churn and contraction from expansion; it measures the floor — what percentage of last year’s ARR you still have this year, before any upsell. For companies above $100,000 ACV, investors expect GRR above 90%. This is not the same bar as NRR. A company can have strong NRR driven entirely by a small number of expanding accounts while the majority of customers quietly churn. Investors model GRR to understand whether the revenue base is stable or whether NRR is masking structural churn.
The magic number. This is the efficiency ratio investors use to evaluate go-to-market leverage: new ARR added in a quarter, annualised, divided by the sales and marketing spend in the prior quarter. Above about 0.75, the go-to-market is generating at least 75 cents of new ARR for every dollar spent. Below 0.5, the growth is expensive and the payback math is unlikely to close at a valuation that makes a fund return work. A magic number above 1.0 is considered best-in-class — you are generating a dollar or more of annualised new ARR for every dollar of prior-quarter S&M spend.
Why the same growth rate produces opposite outcomes
Consider two companies, both at $1.2M ARR, both growing at 80% year-on-year.
Company A: CAC payback of 28 months. NRR of 88%. GRR of 82%. Magic number of 0.4. The growth is real. The problem is that the growth is expensive, the existing base is contracting, and the go-to-market is not yet leveraged. An investment committee modelling a 5-year hold at a 15× ARR entry multiple cannot close the return without assuming improvements in all four metrics. That assumption compounds across five years. The model does not close.
Company B: CAC payback of 11 months. NRR of 118%. GRR of 94%. Magic number of 0.9. Same headline growth number, same ARR. The investment committee models a stable and expanding base, an efficient go-to-market, and a payback period short enough that capital recycled from early customers partially funds the next cohort. The model closes at multiple entry multiples. Company B raises. Company A spends six months in investor meetings unable to understand why.
What to do about it
The founders who walk into a Series A and get to yes have generally done one thing differently: they ran the investment committee’s model before the meeting. They knew their four numbers. They knew which benchmark they met, which they missed, and by how much. They had a narrative for the gap — not a defence, a plan — and they could show the trend line.
Investors do not expect perfection. They expect pattern recognition. A founder who says “our NRR is 104% — we know that’s median, not best-in-class; here is the cohort analysis that shows why our 2024 cohort is trending to 115% at the 12-month mark” has demonstrated something more valuable than a perfect number. They have demonstrated that they understand how the model works.
The specific steps: know your ACV, look up the benchmark range for that ACV tier, calculate your four numbers against that range, identify your widest gap, build a two-quarter plan to close it, and arrive at the meeting with the trend data, not just the point-in-time number.
The Verdict™ read
Investors stopped buying growth narratives in 2022. They buy growth they can model — growth with an efficiency signature that tells them where the company ends up in year five, not just year one. The four efficiency numbers are not a fundraising trick. They are a description of how well the business is working. Founders who know them are not better at fundraising. They have built a better business, and they can prove it.
Growth gets you the meeting. Efficiency gets you the term sheet. Walk in having already done the underwriter’s arithmetic, and you’ve turned a pitch into a formality.
Sources
- Benchmarkit — 2024 B2B SaaS Benchmarks: benchmarkit.ai
- CAC payback benchmarks by ACV tier: optif.ai